


08-02-2017, 02:47
Looks like I may have an issue to investigate..???
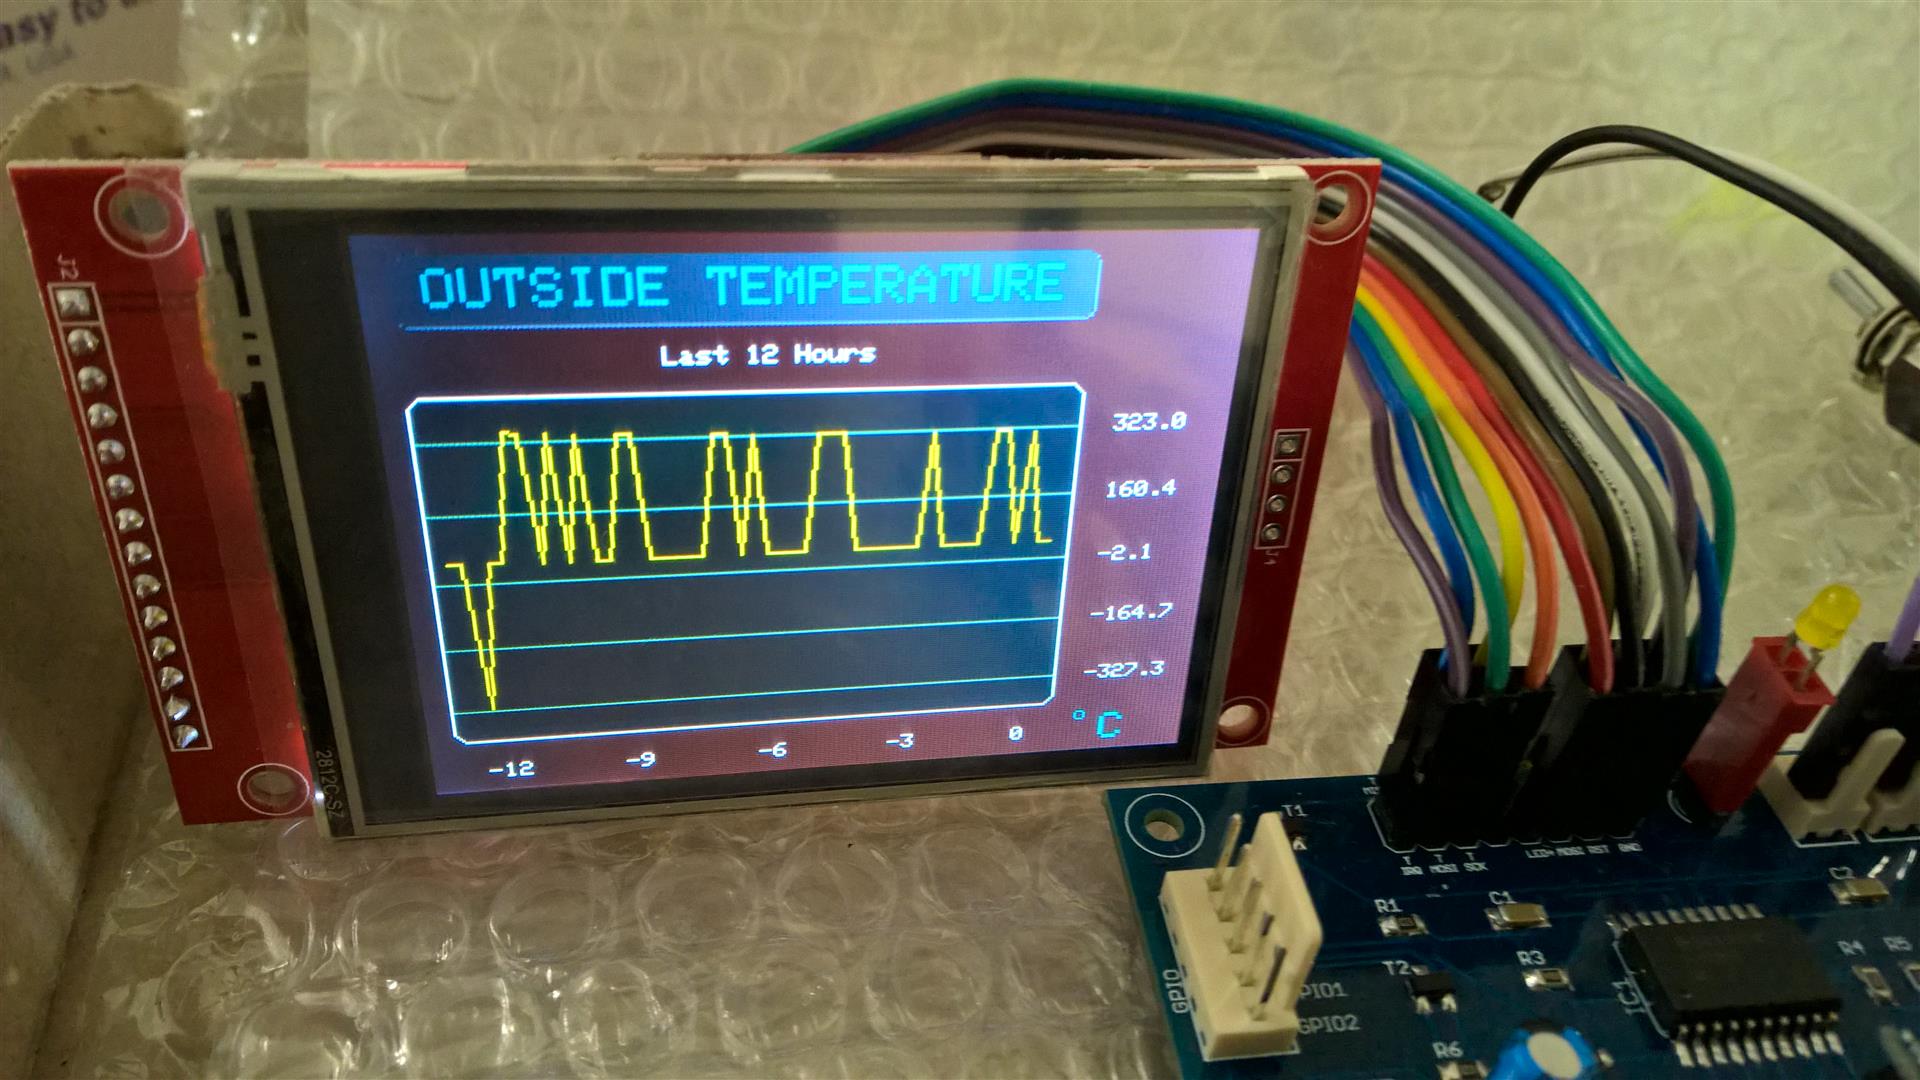
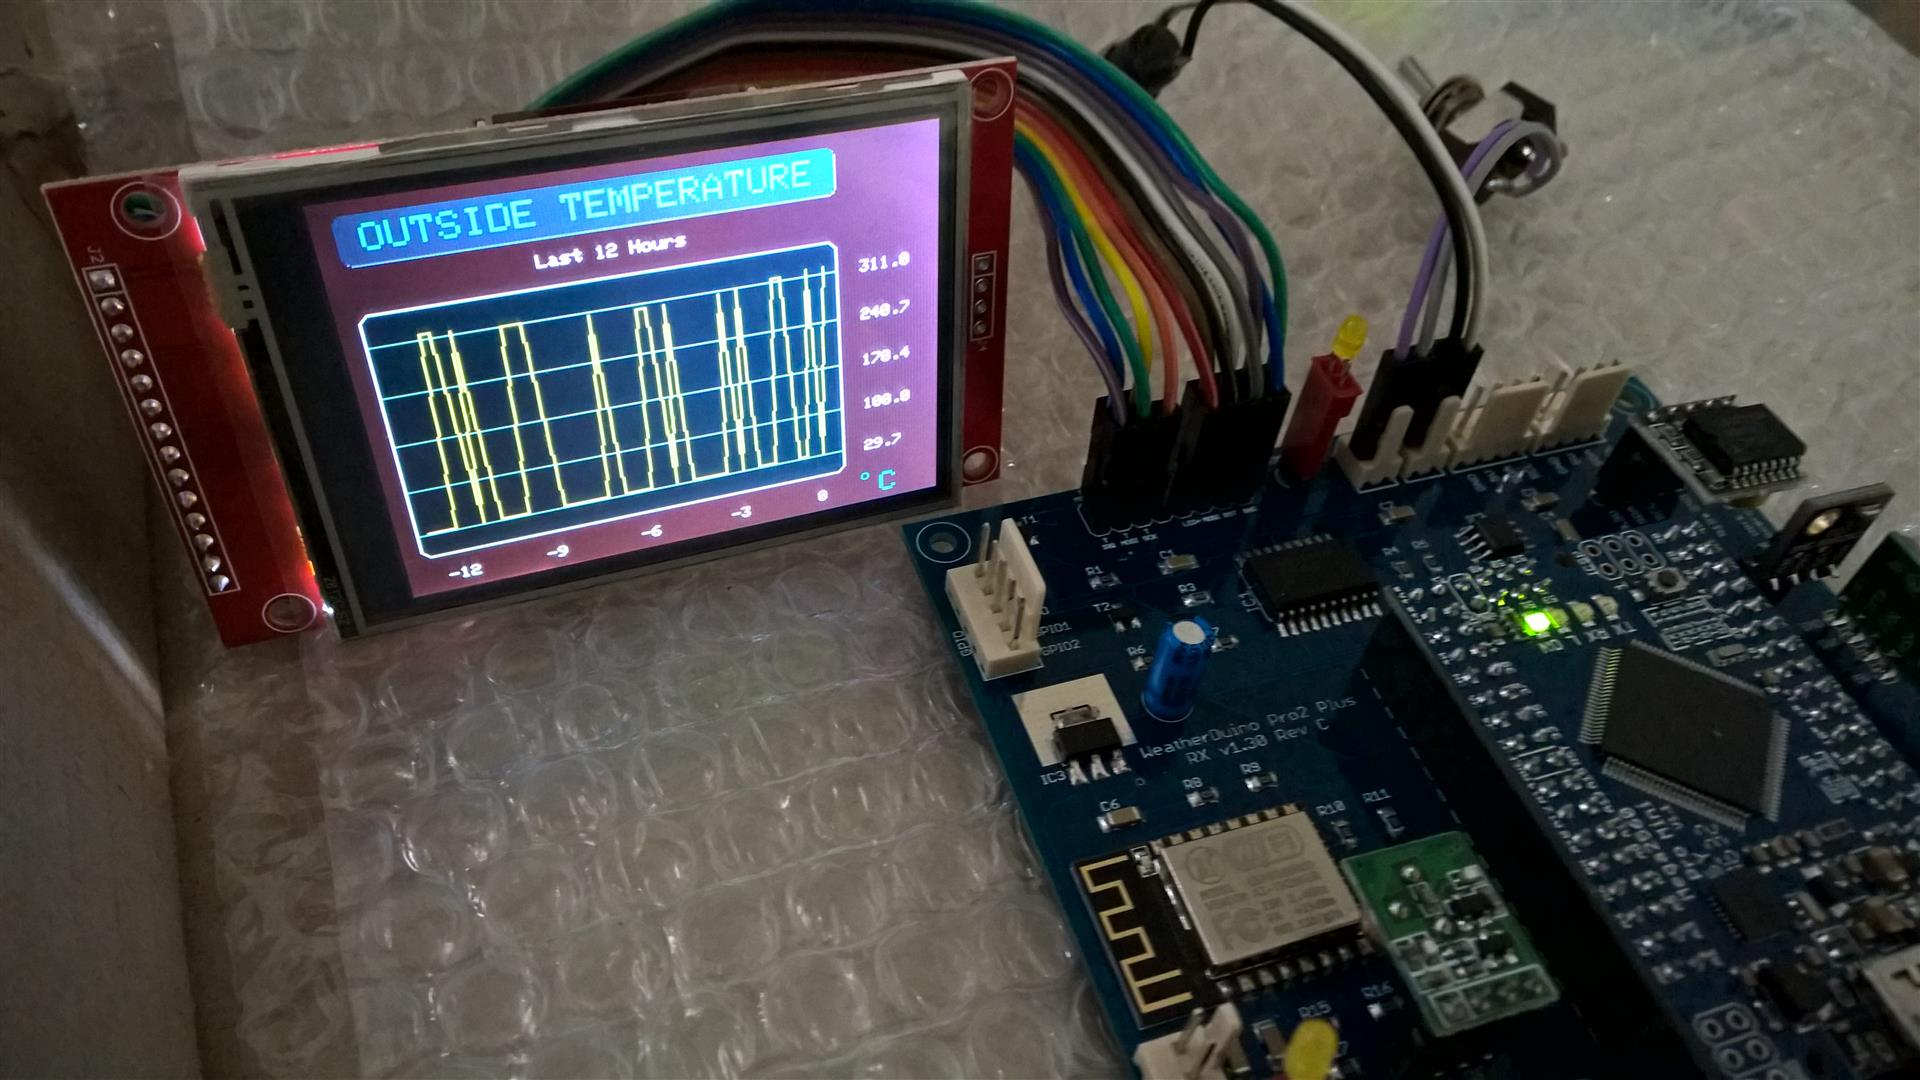
Have been testing a new weather station which has just been built over the past couple of weeks and will eventually be heading to a mate in Sydney for installation on his house. With the new 433Mhz modules now installed, the RF link looks solid. Currently have the 3.12 TX in the storeroom with a DHT22 attached to feed in some data. The Pro2+ RX station is sitting in the Kitchen, about 10m away.
The main screen looks good and getting constant temp readings and no issues and no "---" readings. I'm getting about 84% efficiency on the RF link. All debug code is turned off and/or rem'ed out at the moment.
When I hit the double-press on the button and change to the graphs, and then swipe over to the temp graph, I am seeing the above readings. Interesting observation is that the erroneous peaks seem to be just about a perfect multiple of 10, to the current actual readings..???
I'll start looking at the issue tonight. Any one got any thoughts out there that may assist..???
Mark R
Have been testing a new weather station which has just been built over the past couple of weeks and will eventually be heading to a mate in Sydney for installation on his house. With the new 433Mhz modules now installed, the RF link looks solid. Currently have the 3.12 TX in the storeroom with a DHT22 attached to feed in some data. The Pro2+ RX station is sitting in the Kitchen, about 10m away.
The main screen looks good and getting constant temp readings and no issues and no "---" readings. I'm getting about 84% efficiency on the RF link. All debug code is turned off and/or rem'ed out at the moment.
When I hit the double-press on the button and change to the graphs, and then swipe over to the temp graph, I am seeing the above readings. Interesting observation is that the erroneous peaks seem to be just about a perfect multiple of 10, to the current actual readings..???
I'll start looking at the issue tonight. Any one got any thoughts out there that may assist..???
Mark R